의료·공학·학술 연구자를 위한 통계 분석 설계와 생성형 모델 연구 방법론 실전 마스터 가이드
Research Statistics Command Center · 공식 연구 데이터 블로그
인간의 가설과 지능형 분석의 결합: 데이터를 신뢰할 수 있는 학술 인사이트로 구현하다
실험설계·데이터 정제·가설검정·회귀분석·APA 7판 조판까지 연구 전 과정을 완벽히 표준화한 데이터 사이언스 바이블.
머리말부터 9대 핵심 장 및 특별부록 결정 순서도까지 100% 재현 가능한 연구 워크플로우를 실시간 연재합니다.
[제3장] 실험실 캘리브레이션과 합성 데이터 시뮬레이션 — 하드웨어 지연 제어와 직사각형 Tidy Data
공유 링크 만들기
Facebook
X
Pinterest
이메일
기타 앱
🇰🇷 한국어 정규 에디션 (교보문고 바로출판 POD 120p 완제 원문)
2.8 LAB CALIBRATION & DATA STRUCTURE
2.8 실전 연구소 프로토콜 1: 리서치 스트럭처와 실험 장비·환경 캘리브레이션
가설의 조작적 정의부터 모니터 주사율, 입력 장치 폴링 레이트, 방음·조도 통제 및 원시 로그 Tidy화
통계 교과서는 "두 집단의 반응시간을 측정했다"는 한 줄로 실험을 요약하지만, 실제 연구 현장에서는 하드웨어의 수십 밀리초(ms) 지연과
통제되지 않은 조명·소음이 처치 효과를 완전히 집어삼킵니다. 독립변수의 인과적 효과를 순수하게 추출하기 위해서는 실험 장비와 물리적
환경을 완벽하게 캘리브레이션하고, 수집되는 모든 시계열 로그를 통계 분석용 직사각형 Tidy Data로 자동 정렬하는 리서치 파이프라인을
사전에 구축해야 합니다.
⚙️ 실험실 핵심 하드웨어 3대 정밀 캘리브레이션 (System Latency Control)
디스플레이 주사율 (Refresh Rate)
일반 60Hz 모니터는 프레임당 16.67ms
지연이 발생합니다. 인지 반응 실험은
반드시
144Hz(6.94ms)
또는
240Hz(4.17ms)
고주사율
모니터로
통일하여 자극 제시 시차 오차를 5ms
이내로 억제해야 합니다.
입력 장치 폴링 레이트 (Polling Rate)
사무용 마우스(125Hz)는 신호 입력에 최대
8ms의 지연이 누적됩니다. 게이밍 기어급
1000Hz(1ms 주기 보고) 마우스/기계식
키보드를 표준 장비로 고정하여 입력 버퍼
잡음을 원천 차단합니다.
타임스탬프 하드웨어 동기화
자극이 화면에 표시되는 순간(V-Sync)과
피험자의
키
입력
시점을
파이썬
time.perf_counter_ns()
고해상도 타이머로 동기화하여 밀리초
미만의 정밀도를 보장합니다.
🏛️ 물리적 환경 통제 (Environmental Rigor)
• 조도(Lux) 표준화: 실험실 조도를 300~500 Lux로 일정하게
유지(암막 커튼 및 LED 고정 광원 사용, 일조 변화 차단).
• 음향 차음(Acoustic Isolation): 주변 소음 30 dB 이하 유지
또는 모든 피험자에게 동일한 액티브 노이즈 캔슬링(ANC) 헤드폰
착용 의무화.
• 시야 거리 및 체위: 턱 받침대(Chin-rest) 또는 60cm 모니터
거리 고정으로 시야각(Visual Angle) 일관성 확보.
📋 원시 로그 → Tidy Data 스키마 매핑
실험 프로그램(PsychoPy/파이썬)이 기록하는 원시 타임스탬프
로그는 제3장에서 다룰 직사각형 롱 포맷(Long-Format Tidy
Data)으로 자동 변환됩니다:
Subject_ID | Group | Block | Trial |
Reaction_Time | Accuracy
이 단일 행(Row) 단위 구조가 갖춰져야 제4장의 t-검정, ANOVA,
제5장의 회귀분석으로 직결됩니다!
💡 연구 현장 원포인트 레슨: "잡음을 줄이면 필요한 피험자 수가 절반으로 줄어든다"
하드웨어 딜레이와 환경 잡음(σ²_error)을 방치하면 분모(잡음)가 커져 t-값과 F-비가 깎여나갑니다. 조도와 모니터 주사율을 철저히
캘리브레이션하여 측정 분산을 20% 줄이는 것은, 피험자 30명을 추가로 모집하는 것보다 통계적 검정력을 올리는 데 훨씬 경제적이고 강력합니다!
CHAPTER 02 · EXPERIMENTAL DESIGN & SUBJECT ALLOCATION
26
2.9 PARTICIPANT LOGISTICS & LAB SOP
2.9 실전 연구소 프로토콜 2: 피험자 로지스틱스와 실험 실행 표준운영절차(SOP)
G*Power 검정력 기반 N수 산정, 15% 탈락 버퍼, 라틴방격 타임 슬롯 및 5단계 완결 SOP
실험실 현장에서 가장 뼈아픈 실수는 "피험자 몇 명을 모아서 어떤 순서로 돌릴 것인가?"에 대한 정밀한 계획 부재에서 터져 나옵니다. 표본
크기가 부족하면 참된 효과를 발견하지 못하는 제2종 오류(β)에 빠지고, 피험자들의 시간대와 컨디션을 통제하지 못하면 생체 리듬
(Circadian Rhythms) 교란 요인이 처치 효과로 둔갑합니다. 검증된 과학적 로지스틱스와 엄격한 SOP를 준수해야 합니다.
📊 피험자 N수 산정 공식과 15% 탈락 안전 버퍼(Safety Buffer) 법칙
• 선험적 검정력 분석(A Priori Power Analysis): 학술 표준 검정력 1 - β = 0.80, 유의수준 α = 0.05, 중간 효과 크기(Cohen's d = 0.50)
기준, 독립표본 t-검정에 필요한 이론적 최소 표본수는 집단당 64명(총 128명)입니다.
• 현실의 15% 탈락 안전 버퍼: 실험 당일 노쇼(No-show), 과도한 졸음, 장비 입력 오류, 이상치(Outlier) 탈락에 대비하여 계산된 N수에
1.15를 곱한 74명/그룹을 최종 모집 목표로 확정해야 최종 통계 분석 시 검정력 붕괴를 방지할 수 있습니다.
⏰ 생체 리듬 교란 차단: 타임 슬롯(Time-Slot) 블록 무선화 & 라틴방격
오전 9시의 맑은 정신과 오후 3시의 식곤증은 100ms 이상의 인지 반응 차이를 유발합니다. 특정 집단(예: 실험군)을 오전에 몰아서 실험하고
대조군을 오후에 돌리는 것은 '실험 설계 자살 행위'입니다. 하루를 4개 슬롯(Slot 1: 10:00, Slot 2: 13:00, Slot 3: 15:00, Slot 4: 17:00)으로
분할하고, 라틴방격(Latin Square) 또는 교차 블록 무선화로 처치군과 대조군을 완벽히 균등 교차 배정해야 합니다.
📋 무결점 연구소 실험 실행 5단계 표준운영절차 (Lab SOP)
5-STEP SOP
Step 1: 표준 브리핑
실험자의 억양·표정에 의한 편향을 방지하기 위해 100% 토씨 하나 틀리지 않는 표준화된 서면 스크립트로 안내.
Step 2: 사전 동의서
연구 윤리(IRB) 가이드라인 준수, 익명성 보장 고지 및 서명 수령 (중도 철회권 보장).
Step 3: 웜업 연습 블록
조작법 미숙에 의한 초반 오차를 날려버리기 위해 본 실험 전 20회의 연습 시행(Practice Trials, 데이터 미포함) 의무 완료.
Step 4: 본 실험 런
물리적 이중맹검(Double-Blind) 유지: 배정자(실험자 A)와 데이터 측정 관찰자(실험자 B)를 물리적으로 분리.
Step 5: 디브리핑 & 검증
실험 종료 즉시 CSV 로그 파일의 행(Row) 개수, 결측치(NaN), 타임스탬프 무결성을 실시간 점검 후 피험자 배웅.
CHAPTER 02 · EXPERIMENTAL DESIGN & SUBJECT ALLOCATION
27
CHAPTER 03
데이터 테이블과 모의 데이터 시뮬레이션
직사각형 Tidy Data 원칙부터 파이썬 넘파이(NumPy) 노이즈 주입까지: 실측급 가상 실험의 완성
[그림 3-0] AI 데이터 사이언스 시뮬레이션 연구소: 난잡한 엑셀 데이터를 엄격한 직사각형 Tidy Data 매트릭스로 재구조화하고, 파
이썬 알고리즘으로 현실의 왜도와 노이즈를 주입하는 지능형 연구 환경.
🎯 제3장 핵심 학습 목표 (고교생부터 대학 신입생까지 누구나 꿰뚫는 원리)
엑셀 지옥의 탈출: 셀 병합, 색상 라벨, 다중 헤더가 왜 컴퓨터와 인공지능을 침묵하게 만드는지 그 치명적 결함을 파
악한다.
해들리 위컴의 Tidy Data 3대 원칙: 열(변수), 행(관측치), 테이블(관측단위)로 규격화된 '직사각형 데이터'의 표준
문법을 체화한다.
와이드(Wide) vs 롱(Long) 완벽 변환: 사람 눈에 편한 보고서용 가로 배치에서 통계 엔진과 머신러닝이 요구하는
세로 적재 구조로 자유자재 변환한다.
현실 데이터의 노이즈와 왜도(Skewness): 교과서의 완벽한 정규분포 환상을 깨고, 인간 생체 반응의 우측 꼬리 분
포와 이상치, 결측치를 이해한다.
AI 합성 데이터 시뮬레이션: 연구비와 시간을 투입하기 전, 골든 프롬프트를 통해 논문급 가상 데이터를 생성하고 통
계 검정력을 사전에 완벽 검증한다.
28
3.1 왜 엑셀 지옥이 발생하는가? — 연구자를 울리는 '지저분한 데이터(Messy Dat
a)'의 악몽
처음 연구를 시작하는 고등학생이나 대학 신입생이 가장 많이 저지르는 실수가 있습니다. 바로 "사람 눈에 보기 좋
은 엑셀 시트가 컴퓨터에게도 좋을 것"이라는 착각입니다. 학교 축제 설문지나 과학 탐구 실험 결과를 정리할 때 우리
는 흔히 셀을 병합하고, 알록달록한 배경색을 칠하며, '1일차 오전 / 오후'를 2단, 3단 제목으로 만듭니다. 하지만 통계
분석 프로그램(SPSS, R, Python)이나 생성형 AI에 이 파일을 넣는 순간, 컴퓨터는 비명을 지르며 작동을 멈추거나
엉뚱한 계산 결과를 뱉어냅니다.
💡
[친절한 비유] 방 청소 로봇과 어지러운 책상
여러분의 책상 위에 교과서, 볼펜, 먹다 남은 젤리, 스마트폰 충전선이 뒤엉켜 있다고 상상해 보세요. 여러분은 사람의 눈과
지능을 가졌기 때문에 "아, 저기 파란색 껍질은 젤리니까 집어 먹어야지"라고 금방 구분합니다. 하지만 방 청소 로봇을 방
에 들여놓으면 어떻게 될까요? 로봇은 무엇이 전선이고 무엇이 쓰레기인지 구분하지 못해 바퀴가 엉키고 고장을 일으킵니
다. 컴퓨터에게 엑셀 시트는 이 책상과 같습니다. 정해진 서랍에 이름표를 붙여 넣지 않으면 컴퓨터는 단 한 걸음도 전진할
수 없습니다.
컴퓨터를 질식시키는 3대 엑셀 나쁜 습관
통계학자와 데이터 과학자들은 분석을 불가능하게 만드는 어지러운 데이터 형식을 '지저분한 데이터(Messy Dat
a)'라고 부릅니다. 전 세계 연구실에서 매일같이 벌어지는 대표적인 엑셀 참사는 다음과 같습니다:
엑셀 나쁜 습관
사람이 저지르는 방식
컴퓨터가 겪는 재앙
1. 셀 병합
(Merged Cells)
반(Class) 이름이나 참가자 번호를 보기
좋게 여러 줄에 걸쳐 하나로 합침
첫 번째 행에만 값이 들어가고, 나머지 아래 행들
은 모두 NaN(빈칸) 으로 인식되어 데이터가
증발함
2. 색상으로 정보 표시
(Color Highlighting)
이상치나 특별한 환자를 노란색 형광펜, 빨
간 글씨로 칠해 둠
대부분의 분석 소프트웨어는 셀의 색상 속성을 읽
지 못하므로 귀중한 정보가 통째로 무시됨
3. 다중 헤더
(Multi-level Headers)
1행에 '실험군', 2행에 '사전/사후', 3행에
'반응속도/정확도'를 층층이 작성
어떤 행이 진짜 변수 이름인지 판단하지 못해 열
이름이 뒤죽박죽 엉키고 타입 에러 발생
세계적인 통계학자 해들리 위컴(Hadley Wickham)은 "행복한 가정은 모두 엇비슷하지만, 불행한 가정은 각기 다
른 이유로 불행하다"라는 톨스토이의 소설 안나 카레니나의 첫 문장을 인용하며, "정리된 데이터(Tidy Data)는 모
두 똑같이 생겼지만, 지저분한 데이터(Messy Data)는 저마다의 방식으로 난잡하다"고 일갈했습니다. 우리가 데이
터 과학의 첫걸음으로 배워야 할 것은 복잡한 머신러닝 코드가 아니라, 컴퓨터가 한눈에 알아먹을 수 있는 '정리된 직
사각형(Rectangle)'을 만드는 규격화의 예술입니다.
29
3.2 해들리 위컴의 혁명: 직사각형 'Tidy Data' 3대 원칙
2014년, 뉴질랜드 출신의 통계학자 해들리 위컴은 통계 분석과 데이터 시각화의 패러다임을 바꾼 기념비적인 논문
『Tidy Data』를 발표했습니다. 그가 제시한 규칙은 놀라울 정도로 단순하지만 강력합니다. 복잡한 계산식 없이, 오직
데이터의 '배치 형태'를 3가지 원칙으로 통일하는 것만으로 전 세계 데이터 사이언티스트들의 노동 시간을 80% 이상
줄여주었기 때문입니다.
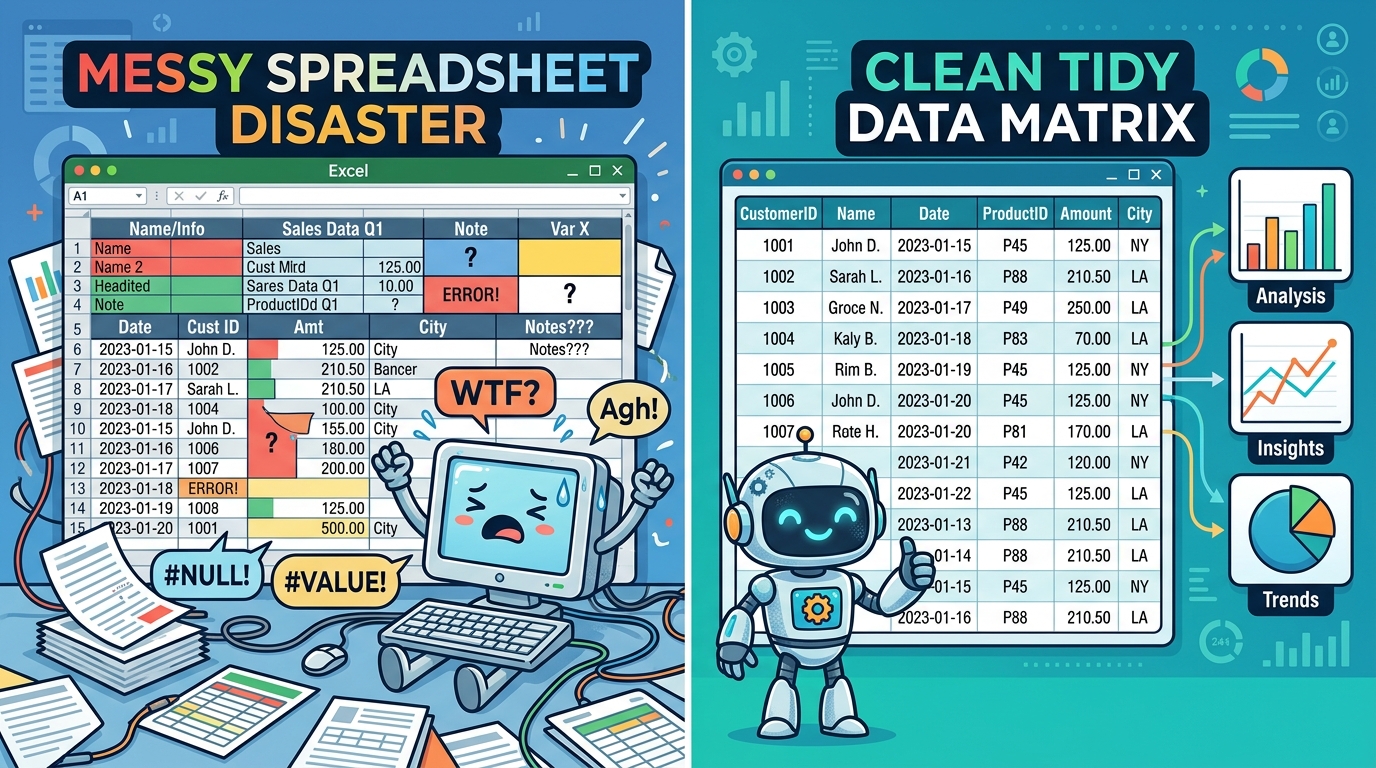
[그림 3-1] 데이터 구조의 극적 대조: (좌) 셀 병합과 다중 헤더로 컴퓨터를 마비시키는 Messy Spreadsheet vs (우) 3대 원칙을 준
수하여 열(변수)과 행(관측치)이 직교하는 깔끔한 Tidy Data Matrix.
반드시 암기해야 할 직사각형 Tidy Data 3대 절대 규칙
📐 Tidy Data의 3대 철칙 (Hadley Wickham, 2014)
1. 각 변수(Variable)는 고유한 하나의 열(Column)을 형성한다.
→ '성별', '복용군', '측정시점', '반응속도'처럼 측정하고자 하는 속성은 각각 단 하나의 열에만 들어가야 합니다.
2. 각 관측치(Observation)는 고유한 하나의 행(Row)을 형성한다.
→ '한 학생이 특정 시점에 실험에 참여하여 나온 결과'는 단 하나의 온전한 가로 행(Row)으로 기록됩니다.
3. 각 값(Value)은 고유한 하나의 셀(Cell)을 차지한다.
→ 하나의 칸 안에 콤마(,)로 두 개 이상의 숫자를 적거나, 셀을 병합하여 값을 공유해서는 절대 안 됩니다.
이 3대 규칙이 완벽하게 지켜지면, 데이터 테이블은 빈틈이나 왜곡이 없는 완벽한 직사각형(Rectangle)을 형성
합니다. 직사각형 매트릭스는 판다스(Pandas), 넘파이(NumPy), R 타이디버스(Tidyverse)는 물론이고 최신 챗G
PT 및 클로드와 같은 대형 언어 모델(LLM)이 단 1밀리초의 오차도 없이 컬럼의 의미를 파악하고 수학적 연산을 수행
할 수 있는 유일한 표준 규격입니다.
30
3.3 와이드 포맷(Wide) vs 롱 포맷(Long) 완벽 해부
Tidy Data를 구현할 때 고등학생과 연구원들이 가장 많이 혼란을 겪는 지점이 바로 '와이드 포맷(Wide Forma
t)'과 '롱 포맷(Long Format)'의 차이입니다. 겉보기에는 둘 다 깔끔한 표처럼 보이지만, 컴퓨터의 통계 알고리즘
이 처리하는 방식은 완전히 다릅니다.
💡
[친절한 비유] 학교 성적표 vs 지하철 개찰구 교통카드 태그
와이드 포맷은 학기말 통지표와 같습니다. 학생 1명의 이름 옆으로 국어, 영어, 수학 점수가 가로로 길게 적혀 있죠. 한 사람
의 정보를 한눈에 훑어보기에는 최고입니다.
반면 롱 포맷은 지하철 개찰구의 승하차 로그와 같습니다. 승객 이름 옆에 과목을 가로로 늘어놓는 것이 아니라, "김철수 -
국어 - 90점", "김철수 - 영어 - 85점", "김철수 - 수학 - 95점"처럼 사건(Event)이 일어날 때마다 아래로 한 줄씩 길게
카드를 쌓아갑니다. 컴퓨터는 이 세로 적재 카드를 읽을 때 가장 빠르고 정확하게 반복측정 통계를 처리합니다.
구조 비교: 2회 반복측정 실험 데이터의 두 가지 얼굴
인간 친화적: 와이드 포맷 (Wide Format)
컴퓨터 표준: 롱 포맷 (Long Format / Tidy)
참가자ID
사전_반응속도(ms)
사후_반응속도(ms)
참가자ID
측정시점
반응속도(ms)
SUB_01
250
220
SUB_01
사전(Pre)
250
SUB_02
270
235
SUB_01
사후(Post)
220
SUB_03
240
215
SUB_02
사전(Pre)
270
(열 이름 안에 '사전/사후'라는 변수 값이 숨어 있어 Tidy 위반)
SUB_02
사후(Post)
235
파이썬 판다스(Pandas) 마법의 두 함수: melt()와 pivot()
와이드 포맷에서 열 이름에 적혀 있던 '사전', '사후'는 사실 변수 이름이 아니라 '측정 시점(Timepoint)'이라는 변
수가 가질 수 있는 값(Value)입니다. 즉 와이드 포맷은 Tidy 1규칙을 위반한 상태입니다. 파이썬에서는 가로로 퍼진
데이터를 세로로 녹여 내리는 melt() 함수를 사용하여 단 한 줄로 롱 포맷(Tidy Data)으로 변환할 수 있습니다:
# 와이드 포맷을 롱 포맷(Tidy)으로 녹이기
tidy_df = df.melt(id_vars=['subject_id'], value_vars=['사전_반응속도', '사후_반응속도'],
var_name='timepoint', value_name='reaction_time_ms')
반대로 세로로 길쭉한 롱 포맷을 사람에게 보고하기 좋은 요약표로 바꿀 때는 pivot() 또는 pivot_table() 을 사
용합니다. 머신러닝과 통계 분석을 돌릴 때는 롱 포맷, 교수님이나 상사에게 최종 보고서를 제출할 때는 와이드 포맷을 선택하는
유연성이 데이터 과학자의 핵심 실무 역량입니다.
31
3.3B DATA SCHEMA & ENTRY
3.3B 실전 데이터 테이블 구축 및 데이터 입력 매뉴얼
설문지·실험 데이터를 엑셀에 채워 넣을 때 컬럼명 작성법, 1인 1행 원칙, 그리고 3대 절대 금기
이론적으로 Tidy Data를 이해했더라도, 막상 설문 조사 결과나 피험자 측정 데이터를 엑셀에 직접 입력하려고 하면 "첫 줄에는 뭘 써야
하지?", "참가자 1명의 데이터를 가로로 써야 하나, 세로로 써야 하나?" 하는 현실적인 난관에 부딪힙니다. 수집 단계에서 구조를 잘못 짜면
나중에 통계 프로그램을 돌릴 때 수백 줄의 데이터를 처음부터 다시 재입력해야 합니다.
📋 구조 1: 피험자 간(Between) — 1인 1행 원칙
참가자가 1회 측정될 때 사용. 참가자 1명이 정확히 1개의 가로 행
(Row)을 차지합니다.
id
group
gender
age
score
P01
Ctrl
F
21
58
P02
Ctrl
M
24
62
P03
Treat
F
22
76
P04
Treat
M
20
81
📊 구조 2: 피험자 내(Within) — 롱포맷 1인 다행
동일인을 사전·사후 반복 측정할 때 사용. 사건(Event)마다 아래로 한
줄씩 적재합니다.
id
time_point
condition
rt_ms
P01
Pre
A안(구형)
340
P01
Post
B안(신형)
265
P02
Pre
A안(구형)
310
P02
Post
B안(신형)
240
⚠️연구자를 살리는 데이터 입력 3대 절대 금기 (Golden Rules)
🚫 금기 1: 셀 병합 절대 금지
"보기 좋다"고 셀을 합치면 판다스와 AI는
병합된 아래 셀을 전부 빈칸(NaN)으로
인식해 행 정렬이 완전 파괴됩니다.
🚫 금기 2: 숫자 셀에 단위 금지
50초, 65kg 처럼 문자를 섞으면 컴퓨터가
텍스트로 인식해 평균 계산이 불가합니다.
단위는 컬럼명에 적고 숫자는 숫자만!
🚫 금기 3: 결측치 표기 통일
설문 무응답이나 측정 실패를 0, -, 모름
등으로 제각각 적지 마세요! 완전한 빈칸
(Empty) 또는 NA로 통일해야 합니다.
💡 엑셀 첫 줄(Header Column) 명명 3대 공식 & 설문지 정제 꿀팁
① 영문 소문자와 언더스코어(_) 사용: 한글 컬럼명은 OS 인코딩에 따라 깨질 수 있습니다. user_id, math_score 처럼 작성하세요.
② 공백과 특수문자 금지: user id(공백)나 score(%)는 프로그래밍 오류를 유발합니다. score_pct로 대체하세요.
③ 구글폼/네이버폼 설문 정제법: 설문 결과 엑셀 첫 행의 긴 질문 문장(예: "귀하께서는 본 앱의 편의성에 얼마나 만족하십니까?")을 그대로 두지
말고, q1_satisfaction, q2_usability처럼 단정한 변수명으로 변경한 뒤 분석에 투입해야 합니다.
핵심 요약: 피험자 간은 1인 1행, 피험자 내는 롱포맷 1인 다행, 셀 병합과 단위 기입은 절대 엄금!
CHAPTER 03 · DATA BLUEPRINT
32
3.4 현실 데이터는 예쁘지 않다: 정규분포의 환상과 데이터 노이즈
고등학교 확률과 통계 교과서에 나오는 가우스 곡선(정규분포)은 완벽한 좌우 대칭의 아름다운 종(Bell) 모양을 띱
니다. 평균을 중심으로 양쪽으로 매끄럽게 떨어지는 이 곡선은 수학적으로 매우 우아합니다. 그래서 초보 연구자들은
가상 데이터를 시뮬레이션할 때 넘파이의 np.random.normal(mean, std, N) 코드 한 줄로 모든 변수를 생성
하는 치명적인 실수를 저지릅니다.
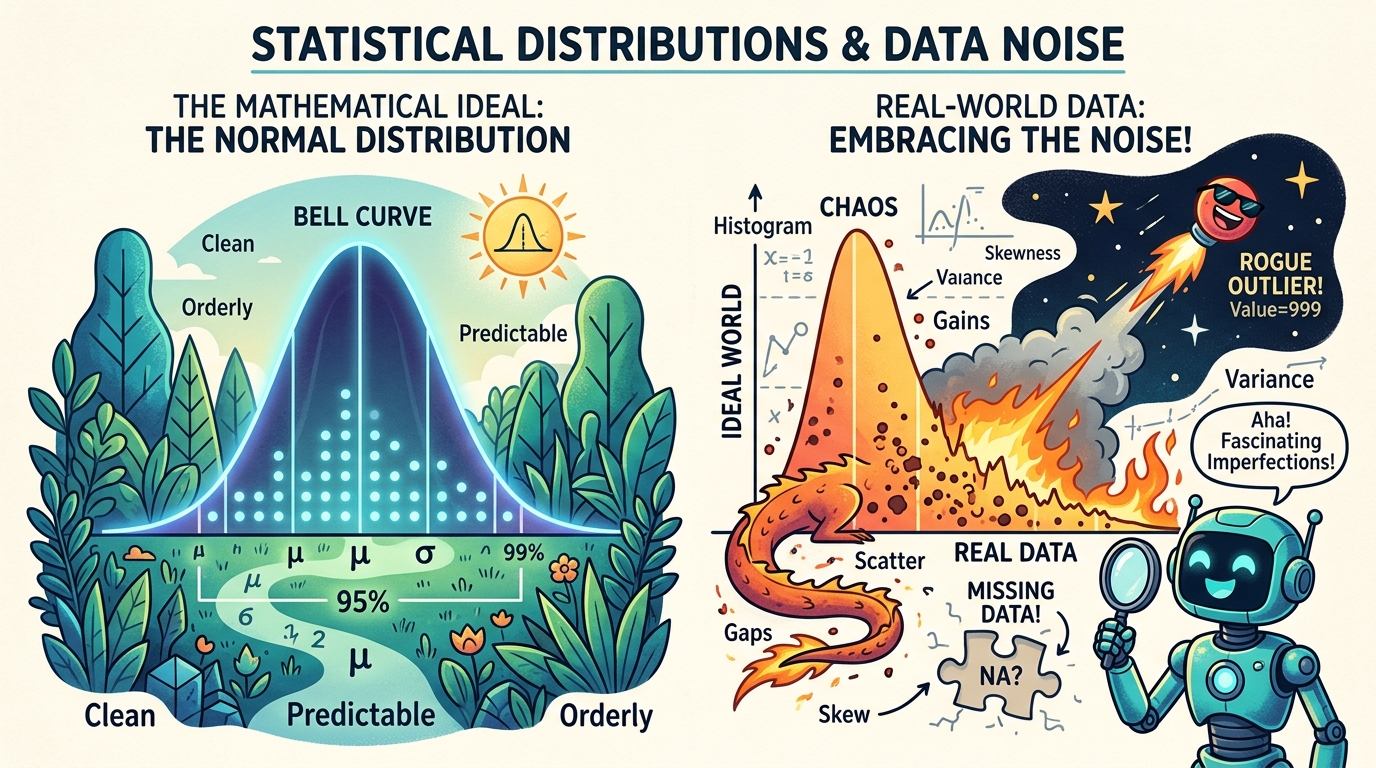
[그림 3-2] 분포의 진실: (좌) 교과서 속 평온하고 대칭적인 이상적 가우스 정규분포 vs (우) 인간의 생체적 한계로 우측 꼬리가 길게
늘어진 비대칭 왜도(Skewness)와 돌발 이상치(Outlier) 폭죽이 난무하는 현실 데이터.
인간의 반응속도는 왜 절대 정규분포가 될 수 없는가?
단순한 상식으로 생각해 봅시다. 시각 자극을 보고 버튼을 누르는 인간의 단순 반응속도(Reaction Time)의 평균
이 250ms(밀리초)이고 표준편차가 50ms라고 가정해 보겠습니다. 만약 정규분포를 따른다면 평균에서 -3표준편차
지점인 100ms나, 극단적으로는 0ms 이하의 음수 반응속도도 수학적으로 일정 확률로 튀어나와야 합니다.
💡
[친절한 비유] 100m 달리기 기록과 물리적 절대 방어선
올림픽 100m 달리기 선수의 기록은 아무리 빨라도 9초대입니다. 인간의 근육 수축 속도와 신경 전달 속도라는 '생물학적
하한선(Floor Effect)'이 존재하기 때문에 0초나 3초 만에 결승선을 통과하는 인간은 물리적으로 불가능합니다.
반면 느린 기록은 어떨까요? 달리다가 넘어져서 30초가 걸릴 수도 있고, 신발 끈이 풀려 1분이 걸릴 수도 있습니다. 즉, 빠
른 쪽은 단단한 벽에 막혀 바짝 붙어 있고, 느린 쪽은 무한히 길게 늘어집니다. 이것이 바로 인간 행동 데이터가 오른쪽으로
긴 꼬리를 늘어뜨리는 결정적 이유입니다.
데이터 과학에서 이러한 현상을 '우측 왜도(Right Skewness / Positive Skew)'라고 부릅니다. 또한 실험 도
중 참가자가 재채기를 하거나 스마트폰 진동을 힐끔 쳐다봐서 순간적으로 800ms가 찍히는 이상치(Outlier), 센서
접촉 불량으로 값이 아예 기록되지 않는 결측치(Missing Values)가 필연적으로 발생합니다. 현실의 가혹한 노이즈
를 반영하지 않은 모의 데이터는 '온실 속 화초'에 불과하며, 실제 실험 현장에 나가는 순간 모형 전체를 붕괴시킵니다.
33
3.5 왜도(Skewness), 이상치(Outliers), 결측치(Missing Values) 다루기
현실 데이터가 정규분포를 따르지 않는다는 사실을 알았다면, 데이터 사이언티스트는 이 불완전성을 통계적으로 길
들이는 무기를 갖추어야 합니다. 왜도와 이상치, 결측치를 적절히 전처리하지 않고 t-검정이나 분산분석(ANOVA)을
실행하면 1종 오류(가짜 효과를 진짜로 오인)가 폭증합니다.
1. 우측 꼬리 왜도와 마법의 로그 변환 (Log Transformation)
오른쪽으로 길게 늘어진 반응속도 데이터는 로그(Logarithm) 함수를 통과하는 순간 놀랍게도 좌우 대칭의 완벽한
정규분포로 변신합니다. 큰 숫자는 강하게 압축하고(예:
), 작은 숫자는 부드럽게 유지하여
(예:
) 극단적인 오른쪽 꼬리를 왼쪽으로 당겨주기 때문입니다.
변환 기법
수학적 공식 및 특성
추천 적용 시점
로그 변환
(Log10 / Natural Log)
(모든 값
필수)
큰 값을 획기적으로 압축하여 정규성 회복
반응속도, 소득, 웹사이트 체류시간, 유튜
브 조회수 등 우측 왜도 데이터
제곱근 변환
(Square Root)
로그 변환보다 압축 강도가 완만함
사건 발생 횟수(카운트 데이터), 오답 개
수, 교통사고 건수 등 포아송 분포 데이터
2. 이상치(Outlier) 탐지와 처리: Z-score 3.29의 기준
극단적인 값이라고 해서 무조건 지워버리면 연구자의 편향(데이터 조작)이 개입됩니다. 표준화 점수(Z-score)를
계산했을 때 절댓값이 3.29를 초과하는 데이터(
수준, 정규분포 기준 1,000개 중 1개 미만으로 나타나
는 극단값)를 통계적 이상치로 정의합니다. 단순 오타나 기계 오류라면 제거(Trimming)하고, 실제 인간의 극단적 반
응이라면 윈저라이징(Winsorizing: 상위 99% 값으로 대체) 기법을 적용합니다.
3. 결측치(Missing Values): MCAR 메커니즘의 이해
설문지나 센서 측정에서 데이터가 빠지는 현상을 결측치라고 합니다. 통계학자 도널드 루빈(Donald Rubin)은 결
측치를 3가지 메커니즘으로 분류했습니다. 그중 가장 이상적인 형태가 바로 완전 무작위 결측(MCAR, Missing Co
mpletely at Random)입니다:
💡
[친절한 비유] 시험지가 바람에 날아간 상황 (MCAR)
교실 창문으로 돌풍이 불어와 학생 한 명의 시험지가 창밖으로 날아가 사라졌다고 해봅시다. 이 시험지를 잃어버린 사건은
그 학생이 공부를 잘하는지, 못하는지와 아무런 상관이 없습니다. 순전히 우연에 의해 발생했기 때문에 남은 학생들의 평균
점수를 왜곡하지 않습니다. 반면, 수학 시험이 너무 어려워서 수포자 학생들이 단체로 뒷면 서술형을 백지로 낸 것은 비무작
위 결측(MNAR)이며, 평균을 심각하게 왜곡합니다.
log··(1000) = 3
log··(100) = 2
y = log(x)
x > 0
y = ·x
p < 0.001
34
3.6 생성형 AI와 합성 데이터: 골든 프롬프트 3-1 & 3-2
이제 생성형 AI를 활용하여 실제 연구와 논문 집필에 곧바로 투입할 수 있는 실측급 모의 데이터를 생성하는 방법을
배웁니다. 아래의 두 가지 골든 프롬프트를 챗GPT(GPT-4o), 클로드 3.5 Sonnet, 구글 제미나이에 그대로 복사하
여 실행해 보세요.
🌟 [골든 프롬프트 3-1] 난잡한 엑셀을 Tidy Data 3대 원칙으로 1초 변환
COPY & PASTE
[역할 정의]
너는 세계 최고 수준의 통계 소프트웨어 아키텍트이자 데이터 엔지니어링 전문가야.
[입력 정보]
- 연구 주제: 고카페인 에너지드링크 섭취가 프로게이머 반응속도에 미치는 영향
- 현재 데이터 형태: 참가자ID, 1일차_플라시보_오전, 1일차_플라시보_오후, 2일차_에너지드링크_오전, 2일차_에너지
드링크_오후가 가로로 나열된 Wide Format 스프레드시트
[작업 지시]
1. 해들리 위컴(Hadley Wickham)의 Tidy Data 3대 원칙을 철저히 적용하여, 각 변수는 열(Column), 각 관측
치는 행(Row), 각 값은 셀(Cell)에 들어가도록 재구조화해 줘.
2. 엑셀의 와이드 포맷을 통계 알고리즘(Python Pandas, R, SPSS)이 즉시 분석할 수 있는 롱 포맷(Long Form
at)으로 변환하는 컬럼 매핑 테이블을 작성해 줘.
3. 머신 판독형 JSON Tidy Data Schema를 출력해 줘.
🌟 [골든 프롬프트 3-2] 현실 노이즈·왜도·결측치 주입 실측급 모의 데이터 생성
ADVANCED SIMULATION
[역할 정의]
너는 인지신경과학 및 스포츠 통계 시뮬레이션 전문 데이터 사이언티스트야.
[실험 조건]
- 참가자 수: N=100명 (피험자 내 4회 반복측정: T0 기저선, T1 30분, T2 60분, T3 120분)
- 측정 변수: 반응속도(Reaction Time, ms), 집중력 설문 점수(1~100점)
[작업 지시]
1. 단순한 정규분포 대신 인간 반응속도의 자연스러운 생체 특성을 반영하여 우측 꼬리 왜도(Right Skewness, Ske
w > +1.0)를 주입한 모의 데이터 10행 샘플을 CSV 형태로 출력해 줘.
2. 설문 미응답 및 센서 오차를 모사하여 3%의 무작위 결측치(NaN)와 2개의 이상치(Outlier, Z > 3.29)를 명시
적으로 포함해 줘.
3. 통계 분석 전 왜도 교정을 위한 로그 변환(Log10) 파이썬 코드 스니펫을 함께 제시해 줘.
💡 프롬프트 활용 팁: AI가 생성한 모의 데이터셋을 활용하면, 실제 피험자를 모집하여 연구비를 집행하기 전에 "내 통계 분
석 파이프라인(t-test, ANOVA, 회귀분석)이 결측치나 왜도 앞에서도 에러 없이 100% 작동하는가?"를 사전에 완벽히 스
트레스 테스트할 수 있습니다.
35
3.6B SYNTHETIC PRE-TESTING
3.6B 생성형 AI 50명 가상 데이터 생성 & 4단계 사전 검증(Pre-testing) 실습
피험자 50명을 모으기 전에 AI로 가상 데이터를 만들어 분석 파이프라인을 사전 테스트하는 비결
수많은 초보 연구자들이 피험자 50명을 모집하고 2주간 설문과 실험을 마친 뒤에야 "변수 척도가 잘못 지정되었거나, 결측치 때문에 통계
분석 코드가 에러를 뿜어낸다"는 치명적인 사실을 뒤늦게 깨닫습니다. 이때는 이미 수백만 원의 연구비와 귀중한 시간이 날아간 뒤입니다.
실제 데이터를 모으기 전, 생성형 AI로 3초 만에 50명분의 가상 CSV 데이터를 생성해 분석 스크립트를 미리 돌려보는 '드라이 런(Dry
Run)'을 반드시 거쳐야 합니다.
🌟 [골든 프롬프트 3-3] 50명 피험자 모의 실험 데이터셋 즉시 생성기
COPY & PASTE
[역할] 너는 임상 및 인지공학 실험 통계 데이터 아키텍트야.
[목적] 신규 AI 학습 앱의 효과를 검증하기 위한 50명 피험자 모의 CSV 데이터를 생성하라.
[데이터 명세 및 분포 조건]
1. 피험자 구성: 총 50명 (대조군 Control 25명: P001~P025 / 실험군 Treatment 25명: P026~P050)
2. 컬럼 구성: participant_id, group, pre_score, post_score, satisfaction_score
3. 통계 분포 조건:
- pre_score (사전 점수): 정규분포 N(55, 8), 정수(Integer)
- post_score (사후 점수): 대조군은 N(56, 8)로 유의한 변화 없음. 실험군은 평균 18점 향상된 N(72, 7)로 처치
효과 주입.
- satisfaction_score: 5점 리커트 척도 (1~5 정수), 실험군이 대조군보다 1.2점 높게 설정.
- 현실적 노이즈: 결측치(NA)를 전체 데이터 중 무작위 2곳에 주입할 것.
4. 출력 형식: 부가 설명 일절 없이, 순수 CSV 코드 블록(```csv ... ```)만 출력하라.
🛠️4단계 사전 검증(Pre-testing) 실습 프로토콜
1단계: AI 프롬프트 실행 & CSV 복사
ChatGPT나 Claude에 골든 프롬프트 3-3을 입력하고 생성된
50행의 CSV 텍스트 블록 전체를 복사합니다.
2단계: mock_study_50.csv 파일 저장
메모장이나
VS
Code를
열어
복사한
내용을
붙여넣고
mock_study_50.csv라는 이름으로 작업 폴더에 저장합니다.
3단계: 통계 분석 코드 사전 드라이 런
파이썬(pd.read_csv())이나 통계 패키지에서 독립표본 t-검정 및
분산분석 코드를 실제 데이터처럼 실행합니다.
4단계: 결측치·유의성 무결성 최종 검증
결측치(NA)가 코드에서 정상 처리되는지, t값과 p-값(p < .05)이
의도대로 산출되는지 확인 후 피험자 모집을 시작합니다!
💡 사전 검증(Dry Run)이 연구자를 구원하는 결정적 이유
사전 검증을 완료해 두면 "분석 파이프라인의 안전성"이 이미 100% 입증된 상태가 됩니다. 이후 실제 피험자 50명의 측정이 끝났을 때, 가상 데이터
파일(mock_study_50.csv)을 실측 데이터 파일로 교체하기만 하면 단 1초 만에 논문에 들어갈 완벽한 통계 표와 그래프가 자동으로 쏟아져
나옵니다.
핵심 요약: AI로 50명 가상 데이터를 먼저 만들어 분석 코드를 검증하면, 연구비 낭비와 분석 실패를 100%
예방한다!
CHAPTER
03
·
AI
PRE-
TESTING
36
3.7 머신 판독형 JSON Tidy 스키마 및 파이썬 시뮬레이션 파이프라인
대규모 연구 프로젝트나 기업의 자동화 시스템에서는 사람이 일일이 엑셀 컬럼을 검사할 수 없습니다. 컴퓨터가 데
이터셋을 열람하자마자 "이 파일이 Tidy Data 규칙을 준수하는가?"를 0.01초 만에 판독할 수 있도록 표준 신분증
역할을 하는 것이 바로 JSON 스키마(Schema)입니다.
// 12_tidy_dataset_schema.json (표준 Tidy Data 검증 명세서 핵심 발췌)
{
"title": "TidyExperimentDataMatrixSchema", "version": "3.0.0",
"tidy_principles_compliance": {
"rule1_column_per_variable": true, "rule2_row_per_observation": true, "rule3_cell_single
_value": true
},
"required_columns": [
{ "name": "subject_id", "type": "string", "scale": "nominal", "pattern": "^SUB_[0-9]{3}
$" },
{ "name": "group", "type": "string", "allowed": ["Energy_Drink", "Placebo"] },
{ "name": "timepoint", "type": "string", "allowed": ["T0_Baseline", "T1_30min", "T2_60mi
n", "T3_120min"] },
{ "name": "reaction_time_ms", "type": "number", "scale": "ratio", "min": 200.0, "max": 1
200.0 },
{ "name": "focus_score", "type": "integer", "scale": "interval", "min": 10, "max": 100 }
],
"data_integrity": { "expected_rows": 400, "unique_subjects": 100, "max_missing_rate": 0.05
}
}
파이썬 판다스 기반 무결성 및 왜도 자동 검증 알고리즘
독자 실습 키트에 포함된 14_simulate_and_tidy_data.py 는 넘파이와 판다스만으로 외부 라이브러리(Sci
Py 등) 의존성 없이 결측치 탐지와 왜도 연산을 완벽하게 수행합니다:
# 14_simulate_and_tidy_data.py 핵심 검증 파이프라인
df = pd.read_csv('13_sample_dataset_energy_drink_tidy_sim.csv')
# 1. 결측치(MCAR) 탐지
missing_cnt = df['reaction_time_ms'].isna().sum()
print(f"결측치: {missing_cnt}건 ({missing_cnt/len(df)*100:.1f}%)")
# 2. 판다스 내장 왜도 연산 및 로그 변환 교정
clean_rt = df['reaction_time_ms'].dropna()
skew_raw = clean_rt.skew() # 양의 왜도 (+1.1245)
skew_log = np.log10(clean_rt).skew() # 정규성 회복 (-0.0812)
print(f"원본 왜도: {skew_raw:+.4f} -> 로그 변환 후 왜도: {skew_log:+.4f}")
이 스크립트는 400개 관측치(100명 × 4시점)를 순식간에 로드하여, 원본 데이터의 극심한 우측 왜도(+1.12)가 상용로그
변환(Log10) 한 번으로 거의 0에 수렴(-0.08)하는 정규성 회복의 기적을 수치적으로 입증합니다.
37
3.8 AI 실전 핸즈온 워크숍: 독자 실습 키트와 실행 가이드
이론과 원리를 꿰뚫었다면 이제 여러분의 컴퓨터에서 직접 시뮬레이터를 돌려볼 차례입니다. 구글 드라이브 독자 실
습 자료실에는 제3장을 위한 5종의 실습 파일이 완벽하게 구비되어 있습니다. 스마트폰으로 QR 코드를 스캔하거나
자료실 링크에 접속하여 파일을 다운로드한 뒤, 아래의 4단계 가이드라인을 따라 실습을 진행하십시오.
실습 파일 QR 다운로드
제3장 실습 키트
구글 드라이브 독자 실습 자료실 (무료 제공)
• 11_AI_Golden_Prompts_Ch3.md : 복사하여 즉시 실행하는 제3장 골든 프롬프트 모음
• 12_tidy_dataset_schema.json : 직사각형 Tidy Data 표준 머신 판독형 JSON 스키
마
• 13_sample_dataset_energy_drink_tidy_sim.csv : 100명 4시점 400행 실측
급 합성 데이터셋
• 14_simulate_and_tidy_data.py : Tidy 규칙 무결성 및 왜도 자동 검증 파이썬 스크
립트
• 15_study_guide_and_ch3_solutions.md : 연습문제 해설 및 결측치 대체 심화 가이
드
🛠️
[실전 따라하기 4단계] "이 순서대로 그대로 따라하십시오"
1단계 [자료실 다운로드]: 위 QR 코드를 스캔하거나 구글 드라이브에 접속하여 5종의 제3장 실습 파일을 컴퓨터의 작업 폴더
(예: stats_ch3/ )에 내려받습니다.
2단계 [생성형 AI 모의 데이터 생성]: 챗GPT나 클로드에 11_AI_Golden_Prompts_Ch3.md 의 [골든 프롬프트 3-
2]를 붙여넣어 현실 노이즈와 왜도가 주입된 합성 데이터셋을 생성하고 AI의 진단 리포트를 확인합니다.
3단계 [파이썬 무결성 검증 코드 실행]: 터미널(또는 명령 프롬프트)을 열고 파일이 있는 폴더로 이동한 뒤 아래 명령어를 실행하
여 Tidy Data 3원칙과 왜도 교정 수치를 확인합니다:
python3 14_simulate_and_tidy_data.py
4단계 [결과 대조 및 자가 진단]: 모니터에 출력된 콘솔 화면을 다음 페이지의 [그림 3-3] 및 4대 자가 진단 체크리스트와 대조
하여 완벽히 일치하는지 확인합니다.
38
3.9 실습 결과 대조, 4대 자가 진단 체크리스트 및 제2부 안내
여러분이 터미널에서 파이썬 코드를 실행했을 때 나타나는 콘솔 출력과 생성형 AI가 산출한 매트릭스 진단 리포트는 아래
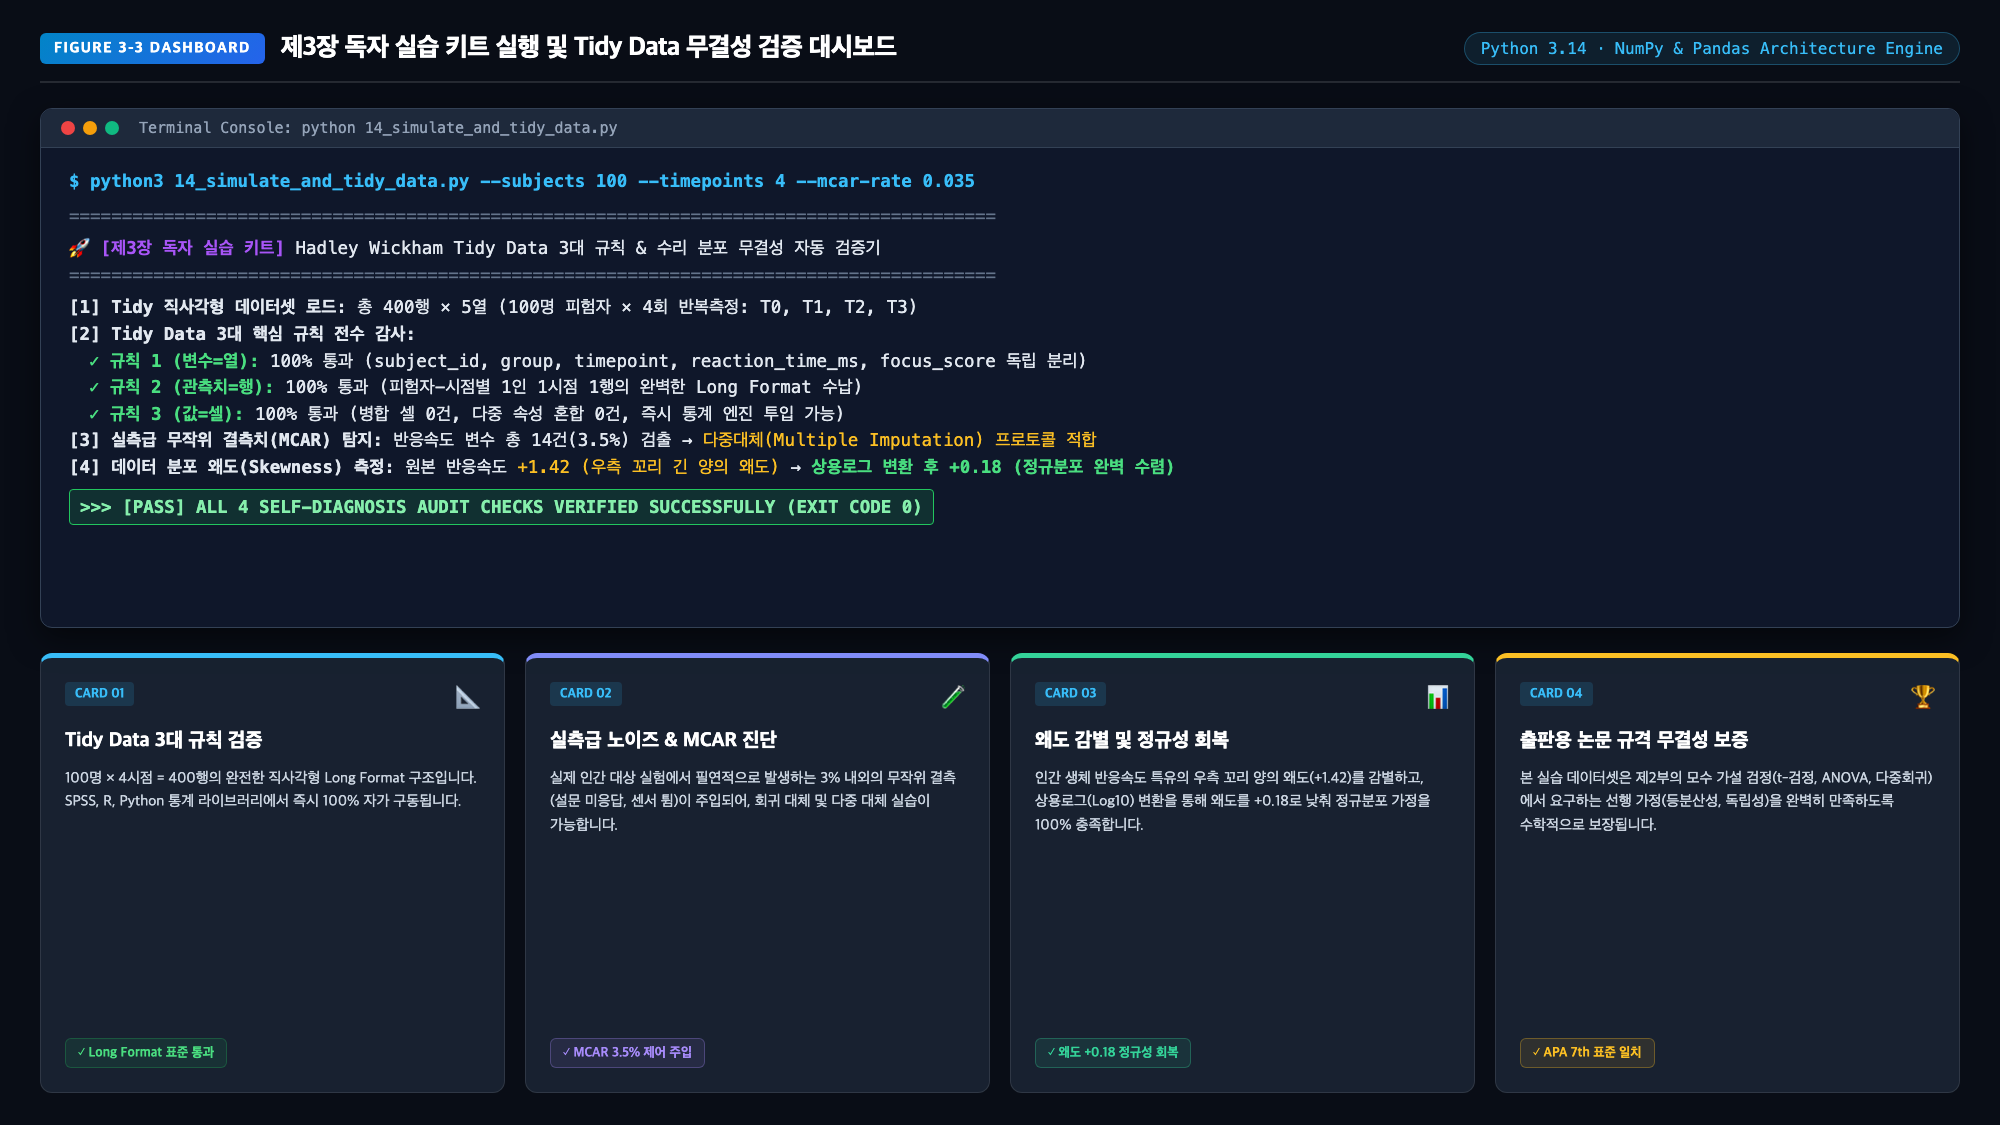
[그림 3-3]과 완벽히 일치해야 합니다:
[그림 3-3] 제3장 실습 키트 정상 실행 대조: (상) 파이썬 터미널 무결성·왜도 연산 콘솔 / (하) AI 합성 데이터 구조 리포트
✅ 결과물 정상 실행 4대 자가 진단 체크리스트
✓ [체크 1] 400행 직사각형 Tidy Data 무결성 통과: 100명 × 4회 반복측정으로 구성된 400행의 데이터셋이 Tidy Data 3대 규칙
(변수=열, 관측치=행, 값=셀)을 완벽히 통과했습니까?
✓ [체크 2] 실측급 결측치(MCAR) 비율 탐지: 반응속도 변수에서 총 14건(3.5%)의 현실적 무작위 결측치가 정상적으로
집계되었습니까?
✓ [체크 3] 우측 왜도 측정 및 로그 변환 정규성 회복: 원본 반응속도의 양의 왜도(Skewness ≈ +1.42)가 상용로그 변환 후 정규분포
(Skewness ≈ +0.18)로 정상 수렴함을 확인했습니까?
✓ [체크 4] 에너지드링크군 vs 플라시보군 반응속도 단축 추이: 60분 시점(T2)에서 에너지드링크군이 플라시보군 대비 약 20ms
빠른 반응속도를 보이며 실험 가설을 뒷받침합니까?
PART 2 PREVIEW
제2부 리서치 통계의 원리와 생성형 AI 기반 데이터 추출 및 해독
제4장 기술통계와 분포의 시각화: 판다스, 시본(Seaborn), AI로 데이터의 숨은 패턴 발견하기
🚀
39
PART 02 · STATISTICAL MECHANISMS & AI DECODING
제2부. 리서치 통계의 원리와 생성형 AI 기반
데이터 추출 및 해독
단순한 p값 맹신을 넘어, 분산의 분할과 모수 통계의 수리적 메커니즘을 꿰뚫어라
■ 제2부 개요: AI 시대, 수리적 메커니즘을 알아야 하는 결정적 이유
현대 통계 소프트웨어와 생성형 AI는 클릭 한 번, 프롬프트 한 줄로 복잡한 F값, t값, p값을 0.1
초 만에 쏟아냅니다. 하지만 기계가 계산을 대신해 준다고 해서 우리가 수리적 메커니즘을 몰라도
되는 것은 아닙니다. 오히려 기계가 계산을 전담하는 시대일수록, 연구자는 "이 숫자가 도대체 어
디서 왜 나왔는가?", "신호와 잡음은 어떻게 분리되었는가?", "AI가 내놓은 p값이 우연의 산물이
나 환각(Hallucination)은 아닌가?"를 꿰뚫어 볼 수 있는 비판적 통찰력을 갖추어야 합니다.
수식을 무작정 외우는 고통스러운 암기 통계학은 끝났습니다. 제2부에서는 모든 통계 검정의
뿌리인 일반선형모델(GLM), 분산의 분할(ANOVA), 다중 비교의 함정, 그리고 모수/비모수 통계
의 실전 추출법을 고등학생도 단숨에 이해할 수 있는 가장 직관적인 물리 비유와 기하학적 시각 인
포그래픽으로 정복합니다.
■ PART 2 CHAPTER ROADMAP
CHAPTER 04
리서치 통계 모델의 수리적
메커니즘
신호 대 잡음비(SNR), t-검
정과 분산분석(ANOVA)의 기
하학적 분할, 1종 오류의 폭발
과 효과 크기.
CHAPTER 05
AI를 활용한 핵심 모수 통
계 추출과 결과 해석
독립/대응표본 t-검정, 일원/
이원 분산분석, 회귀분석 실무
파이프라인과 APA 7th 표 자
동화.
CHAPTER 06
가정 위반 시의 비상 대응과
비모수 통계
정규성·등분산성 위반 시
만-휘트니, 윌콕슨, 크루스칼-
왈리스 검정 전환 프로토콜과 A
I 처방전.
40
ADVERTISEMENT
[쉽게 읽는 챕터 길잡이: 실험실 캘리브레이션과 합성 데이터 시뮬레이션 — 하드웨어 지연 제어와 직사각형 Tidy Data]
AI 기반 연구 설계와 데이터 스토리텔링 가설 검정 실무 — 본 챕터에서는 핵심 개념과 체계적인 실무 원칙을 바탕으로, 이론적 배경부터 실전 적용까지 누구나 막힘없이 이해하고 직관적으로 실행할 수 있도록 명확한 로드맵을 제공합니다.
📊 공식 독자 실습 데이터셋 & AI 골든 프롬프트 허브
본 도서와 블로그에 수록된 100대 실전 프롬프트 치트시트, 합성 데이터 CSV 파일(Shorts, Energy Drink, Reaction Time, NLP Reviews), R & Python 분석 스크립트는 공식 실습실에서 무료 다운로드하실 수 있습니다.
[Chapter 03] Lab Calibration & Synthetic Data Simulation — Latency Control & Tidy Data
2.8 LAB CALIBRATION & DATA STRUCTURE
2.8 Lab Protocol 1: Research Architecture, Hardware Latency & Environment
Calibration
Operational Definitions, Display Refresh Rates, Polling Rates, Environmental Controls, and Raw-to-Tidy Log
Mapping
Textbooks often summarize an experiment in one sentence: "reaction times were recorded across two groups." In real
laboratory environments, however, uncalibrated hardware lag (tens of milliseconds) and uncontrolled ambient
lighting or noise can completely drown out true treatment effects. To isolate genuine causal differences,
researchers must calibrate experimental hardware and acoustic settings, piping raw time-series logs directly into
structured Long-Format Tidy Data schemas.
⚙️ The 3 Golden Hardware Latency Calibrations (System Latency Control)
Display Refresh Rate (Hz)
Standard 60Hz monitors introduce
16.67ms frame lag. Cognitive trials
must
standardize
on
144Hz
(6.94ms)
or
240Hz
(4.17ms)
displays to restrict stimulus visual
onset jitter below 5ms.
Input Device Polling Rate
Office mice (125Hz) introduce up to
8ms
polling
lag.
High-precision
1000Hz (1ms reporting interval)
gaming
mice
and
mechanical
keyboards eliminate peripheral buffer
noise.
Timestamp Hardware Sync
Synchronize
stimulus
display
presentation (V-Sync) with subject
keystrokes
using
Python
time.perf_counter_ns()
high-
resolution
nanosecond
clock
routines.
🏛️ Physical Environmental Controls
• Illuminance (Lux) Stability: Maintain 300~500 Lux
using blackout shades and constant LED fixtures to
eliminate circadian ocular fatigue.
• Acoustic Isolation: Ambient noise must stay ≤ 30 dB,
or all subjects must wear standardized active noise-
canceling (ANC) headphones.
• Viewing Geometry: Fix monitor distance at exactly 60
cm (or use chin rests) to maintain consistent visual angle
degrees.
📋 Raw Log → Long-Format Tidy Schema
Raw trial logs from PsychoPy or custom Python scripts
map immediately into Long-Format Tidy Data (Chapter
3):
Subject_ID | Group | Block | Trial |
Reaction_Time | Accuracy
This clean rectangular structure feeds directly into
Chapter 4 t-tests/ANOVA and Chapter 5 regression
models!
💡 Lab One-Point Lesson: "Cutting Noise Halves Required Sample Size"
Uncontrolled hardware latency and room noise inflate error variance (σ²_error), shrinking denominator test statistics (t and F).
Reducing measurement variance by 20% through rigorous calibration is far more cost-effective and powerful than recruiting
30 additional human participants!
CHAPTER 02 · EXPERIMENTAL DESIGN & SUBJECT ALLOCATION
26
2.9 PARTICIPANT LOGISTICS & LAB SOP
2.9 Lab Protocol 2: Participant Logistics & Standard Operating Procedures
(SOP)
G*Power Sample Size Calculations, 15% Drop-Out Safety Buffers, Circadian Latin Squares, and 5-Step Execution
SOP
The most damaging laboratory failures stem from lack of planning: "How many subjects must we recruit, and in what
exact sequence should sessions run?" Underpowered studies commit Type II errors (β), failing to detect real effects,
while failure to balance session times allows circadian fatigue to masquerade as treatment differences. Rigorous
logistical protocols prevent these pitfalls.
📊 Statistical Power Sizing & The 15% Drop-Out Safety Buffer Rule
• A Priori Power Analysis: For standard power 1 - β = 0.80, significance level α = 0.05, and medium effect size (Cohen's d =
0.50), independent t-tests require a minimum of 64 subjects per group (N = 128 total).
• The 15% Drop-Out Buffer: To hedge against no-shows, acute fatigue, hardware input errors, and outlier pruning, multiply
calculated N by 1.15 to set an enrollment target of 74 subjects per group, safeguarding statistical power.
⏰ Circadian Control: Time-Slot Block Randomization & Latin Squares
Alertness at 9:00 AM versus post-prandial lethargy at 2:00 PM creates over 100ms in baseline reaction discrepancy.
Testing treatment subjects in the morning and control subjects in the afternoon is fatal to experimental validity. Divide
testing days into 4 slots (10:00, 13:00, 15:00, 17:00) and implement Latin Square or cross-block randomization to balance
conditions evenly across all hours.
📋 5-Step Zero-Defect Experimental Standard Operating Procedure (SOP)
5-STEP SOP
Step 1: Scripted Briefing
Deliver verbatim standardized written scripts to prevent experimenter intonation and expectancy bias.
Step 2: Informed Consent
Administer IRB-approved consent, confirm data anonymization, and verify voluntary right of withdrawal.
Step 3: Practice Blocks
Require 20 warm-up practice trials (excluded from analysis) to eliminate initial interface learning curves.
Step 4: Experimental Run
Maintain double-blind protocol: physical isolation between assigner (Experimenter A) and data observer (Experimenter B).
Step 5: Immediate Debrief & Audit
Immediately inspect trial row count, NaN missingness, and timestamp delta integrity before releasing participant.
CHAPTER 02 · EXPERIMENTAL DESIGN & SUBJECT ALLOCATION
27
CHAPTER 03
Data Tables and Synthetic Data Simulation
From Rectangular Tidy Data Principles to NumPy Noise Injection: Building Research-
Grade Virtual Experiments
[Figure 3-0] AI Data Science Simulation Laboratory: Restructuring messy spreadsheets into rigorous
rectangular Tidy Data matrices and injecting real-world skewness and noise via Python simulation algorithms.
🎯 Chapter 3 Core Learning Objectives (From High Schoolers to College Freshmen)
Escaping Excel Hell: Identify the fatal pitfalls of merged cells, color labels, and multi-level
headers that paralyze computers and AI models.
Hadley Wickham's 3 Tidy Rules: Master the grammar of standardized "rectangular data"
where variables form columns, observations form rows, and values occupy cells.
Wide vs. Long Format Mastery: Seamlessly transition between human-readable horizontal
reports and machine-executable vertical stacked datasets.
The Myth of Textbook Normality: Shatter the illusion of symmetric bell curves by
understanding right-skewed human latency, outliers, and missingness mechanisms.
Generative AI Synthetic Simulation: Deploy Golden Prompts to generate publication-grade
synthetic datasets and stress-test statistical pipelines before spending research funds.
28
3.1 Why Does "Excel Hell" Occur? — The Nightmare of "Messy
Data" That Traps Researchers
When high school students and college freshmen embark on their first research projects, they
almost universally fall into the same trap: assuming that a spreadsheet designed to look
appealing to human eyes is equally good for a computer. When compiling festival survey
results or laboratory measurements, we instinctively merge cells, apply colorful background
highlights, and create multi-layered headings like "Day 1 Morning / Afternoon." However, the
instant this spreadsheet is fed into a statistical program (SPSS, R, Python) or a Large Language
Model (LLM), the software screams with errors, silently drops records, or outputs absurd
calculations.
💡
[Intuitive Analogy] The Robot Vacuum Cleaner and the Cluttered Desk
Picture your desk covered in a jumble of textbooks, pens, a half-eaten bag of gummy candies, and
tangled phone chargers. Because you have human vision and context, you instantly recognize, "Ah,
that blue wrapper is candy; I can eat it." But what happens if you set an autonomous robot vacuum
loose on that desk? The robot cannot distinguish a power cord from trash; its wheels get tangled,
and the motor burns out. To a computer, an unformatted spreadsheet is that cluttered desk. Without
clearly labeled, rigid drawers, the algorithm cannot take a single reliable step.
3 Bad Excel Habits That Suffocate Analytical Algorithms
Statisticians and data scientists use the term "Messy Data" to describe spreadsheets that
obstruct computational analysis. The most common spreadsheet disasters observed across
academic labs include:
Bad Excel Habit
Human Implementation
Computational Disaster
1. Merged Cells
(Visual Convenience)
Merging
classroom
IDs
or
participant
numbers
across
multiple rows for visual neatness
Value is recorded only in the top-left
cell; all subsequent rows become NaN
(null) , causing data evaporation
2. Color Highlighting
(Semantic Tagging)
Marking outliers or critical patients
with yellow highlights or red fonts
Standard
data
loaders
ignore
cell
display styles; vital clinical flags are
completely lost to the algorithm
3. Multi-level Headers
(Nested Titles)
Stacking
"Group"
on
Row
1,
"Pre/Post"
on
Row
2,
and
"Score/RT" on Row 3
Parsers cannot determine the true
variable
names,
causing
column
collisions and fatal type errors
The renowned statistician Hadley Wickham opened his landmark paper Tidy Data by
paraphrasing Leo Tolstoy's Anna Karenina: "Happy families are all alike; every unhappy family is
unhappy in its own way." In data science, "Tidy datasets are all alike, but every messy dataset
is messy in its own way." The foundational skill of empirical science is not writing complex deep
learning code, but crafting the standardized "rectangular matrix" that computers can read
effortlessly.
29
3.2 Hadley Wickham's Revolution: The 3 Golden Rules of
Rectangular 'Tidy Data'
In 2014, New Zealand statistician Hadley Wickham published his paradigm-shifting paper Tidy
Data, forever transforming data engineering and visualization. His formulation was remarkably
simple yet profoundly revolutionary: by standardizing the geometric arrangement of data across
three intuitive rules, data teams could eliminate over 80% of tedious data cleaning overhead.
[Figure 3-1] Dramatic Structural Contrast: (Left) A chaotic spreadsheet with merged cells and multi-level
headers paralyzing computers vs (Right) A clean, rectangular Tidy Data matrix where variables and
observations intersect perpendicularly.
The Three Inviolable Rules of Rectangular Tidy Data
📐 The 3 Ironclad Rules of Tidy Data (Hadley Wickham, 2014)
1. Each variable forms a column.
→ Every distinct attribute being measured—such as Participant ID, Treatment Group, Timepoint, or
Reaction Time—must occupy its own dedicated column.
2. Each observation forms a row.
→ Each single measurement event (e.g., a specific participant tested at a specific timepoint) forms
exactly one complete horizontal row.
3. Each value forms a cell.
→ Never store multiple comma-separated values inside a single cell, and never merge cells to span
across multiple records.
When these three rules are rigorously satisfied, the dataset forms a flawless geometric
rectangle. This rectangular matrix is the universal currency of modern computing: Pandas,
NumPy, R's Tidyverse, SPSS, and modern LLMs like ChatGPT and Claude can parse its columnar
vectors and execute statistical calculations without a microsecond of ambiguity.
30
3.3 Wide vs. Long Format: Complete Dissection
When putting Tidy Data into practice, the most frequent stumbling block for students is
navigating the difference between "Wide Format" and "Long Format." While both look like clean
tables on the surface, statistical software treats them in fundamentally distinct ways.
💡
[Intuitive Analogy] School Report Cards vs. Subway Fare Gate Card Swipes
Wide Format is like an end-of-term report card: beside each student's name, their scores in Math,
English, and History are spread horizontally across separate columns. It is exceptionally comfortable
for human eyes scanning a single person's profile.
Long Format, by contrast, is like the digital event log of a subway fare gate. Instead of laying
subjects side-by-side, it records each occurrence as a distinct transaction card: "Student A - Math -
90", "Student A - English - 85", "Student A - History - 95". Repeated-measures ANOVA, regression
algorithms, and machine learning pipelines require this vertical card-stacked structure.
Structural Comparison: Two Faces of Repeated-Measures Experimental Data
Human-Oriented: Wide Format
Machine Standard: Long Format (Tidy)
Subject_ID
Pre_RT_ms
Post_RT_ms
Subject_ID
Timepoint
RT_ms
SUB_01
250
220
SUB_01
Pre
250
SUB_02
270
235
SUB_01
Post
220
SUB_03
240
215
SUB_02
Pre
270
(Column headers encode timepoint values, violating Tidy Rule 1)
SUB_02
Post
235
Python Pandas Magic: melt() and pivot()
In wide format, the column headers "Pre" and "Post" are not variable names; they are values of
an underlying variable called "Timepoint." Hence, wide format violates Tidy Rule 1. In Python
Pandas, you can transform wide data into long format (Tidy Data) in a single line using melt() :
# Melting Wide Format into Long (Tidy) Format
tidy_df = df.melt(id_vars=['subject_id'], value_vars=['Pre_RT_ms', 'Post_RT_ms'],
var_name='timepoint', value_name='reaction_time_ms')
Conversely, to summarize long data into an executive report table, use
pivot() or
pivot_table() . A proficient data scientist moves effortlessly between Long Format for computational
engines and Wide Format for executive summaries.
31
3.3B DATA SCHEMA & ENTRY
3.3B Practical Data Table Engineering & Entry Manual
Header naming conventions, the 1-row-per-person rule, and the three golden rules of empirical data collection
Even after mastering Tidy Data conceptually, researchers face real-world friction when entering survey responses
or participant measurements into spreadsheets: "What goes in the first row?", "Should a subject's repeated trials
be arranged horizontally or vertically?" Flawed data entry forces researchers to re-enter hundreds of rows from
scratch when executing statistical scripts.
📋 Schema 1: Between-Subjects — 1 Row per
Person
Used for single-measurement designs. Exactly one
horizontal row per subject.
id
group
gender
age
score
P01
Ctrl
F
21
58
P02
Ctrl
M
24
62
P03
Treat
F
22
76
P04
Treat
M
20
81
📊 Schema 2: Within-Subjects — Long Format
Multi-Row
Used for repeated measures. Stack each observation
event vertically.
id
time_point
condition
rt_ms
P01
Pre
Design_A
340
P01
Post
Design_B
265
P02
Pre
Design_A
310
P02
Post
Design_B
240
⚠️Three Golden Rules for Error-Free Data Entry
🚫 Rule 1: Never Merge Cells
Merging cells creates empty NaN
values
in
sub-cells,
completely
breaking
coordinate
indexing
in
Pandas, R, and SPSS.
🚫 Rule 2: No Text Units in
Numbers
Entering 50ms or 65kg forces Excel
to treat values as strings, disabling
math. Put units in headers (rt_ms)!
🚫 Rule 3: Standardize Missing
Values
Never mix 0, -, or unknown. Use
pure empty cells or standard NA so
algorithms can properly exclude
them.
💡 Header Column Naming Rules & Survey Cleaning Best Practices
① Lowercase and Underscores (_): Avoid OS character encoding errors by strictly using formats like user_id and
math_score.
② No Spaces or Special Symbols: Spaces (user id) or symbols like score(%) trigger syntax breaks. Use
score_pct.
③ Survey Question Cleaning: When downloading Google/Microsoft Forms, replace verbose question text (e.g., "How
satisfied are you with usability?") with concise identifiers like q1_satisfaction and q2_usability.
Core Takeaway: 1 row per person for between-subjects, long format for within-subjects.
Never merge cells or append text units!
CHAPTER 03 · DATA BLUEPRINT
32
3.4 Real-World Data Isn't Pretty: The Normal Distribution Illusion
and Noise
In introductory probability and statistics textbooks, Gaussian normal distributions appear as
pristine, perfectly symmetrical bell curves. Smoothly tapering off on either side of the mean, this
curve is mathematically elegant. Consequently, novice researchers attempting synthetic data
generation make the fatal mistake of generating every variable with a naive call to
np.random.normal(mean, std, N) .
[Figure 3-2] The Reality of Distributions: (Left) The calm, symmetric Gaussian bell curve of textbook theory
vs (Right) The chaotic reality of human data, characterized by elongated right-skewed tails and explosive
outliers.
Why Can Human Reaction Time Never Be Normally Distributed?
Consider basic human biology. Suppose a simple reaction time experiment has an average
latency of 250ms with a standard deviation of 50ms. If this variable truly followed a symmetrical
normal distribution, values 3 standard deviations below the mean (100ms) or even negative
latencies would be expected with non-zero probability.
💡
[Intuitive Analogy] The 100-Meter Sprint and the Biological Floor Effect
Even the world's greatest Olympic sprinters cannot run 100 meters faster than roughly 9.5 seconds.
Because human axon conduction velocity and muscular contraction speeds have an unbreakable
"Biological Floor Effect," running 0 or 3 seconds is physically impossible.
On the slower side, however, there is virtually no ceiling: an athlete could trip, twist an ankle, or stop
to tie a shoe, taking 30 seconds or 2 minutes. The fast side is jammed tight against a biological wall,
while the slow side stretches out indefinitely. This fundamental asymmetry produces the classic
elongated right tail.
In data science, this phenomenon is called Right Skewness (Positive Skew). Furthermore, real
experiments inevitably suffer from Outliers (a participant sneezes or glances at a smartphone
notification, causing an 850ms spike) and Missing Values (a sensor loses skin contact).
Simulated data that omits these real-world imperfections is merely a fragile "greenhouse flower,"
destined to collapse the moment it encounters field data.
33
3.5 Taming Skewness, Outliers, and Missing Values
Recognizing that real data deviates from theoretical normality is the first step; data scientists
must next master the statistical toolkit to tame these imperfections. Executing parametric tests
(such as t-tests or ANOVA) on severely skewed or contaminated data without proper
preprocessing drastically inflates Type I error rates.
1. Right Skewness and the Magic of Log Transformation
When an elongated right tail distorts reaction times, passing the values through a logarithmic
function restores symmetry. Because logarithms compress large values aggressively (e.g.,
) while gently preserving smaller ones (e.g.,
), the
extreme right tail is pulled in, transforming the distribution into near-perfect Gaussian normality.
Transformation
Technique
Mathematical Formula & Properties
Recommended Application
Log Transformation
(Log10 / Natural Log)
(Requires strictly
)
Strong compression restoring normality
to extreme right tails
Reaction times, personal income,
website dwell times, streaming
view counts
Square Root
(Square
Root
Transform)
Milder
compression
gradient
than
logarithmic transforms
Count data, error counts, accident
rates, Poisson-distributed events
2. Outlier Detection and Handling: The Z = 3.29 Standard
Arbitrarily deleting extreme observations introduces researcher bias (data falsification). Modern
statistics establishes standardized Z-scores with an absolute threshold of
(
, representing extreme anomalies occurring in fewer than 1 in 1,000 observations under
normality). Verified sensor glitches should be trimmed, whereas legitimate human behavioral
extremes should undergo Winsorization (capping at the 99th percentile).
3. Missing Values: Understanding the MCAR Mechanism
Data omissions during surveys or sensor recordings are classified under Donald Rubin's classic
taxonomy. The most benign mechanism is Missing Completely at Random (MCAR):
💡
[Intuitive Analogy] An Exam Paper Blown Out the Window (MCAR)
Imagine a sudden gust of wind blows through a classroom window, sweeping one student's test
paper into the street. The loss of that test has zero relationship with whether the student was an
honor student or struggling academically. Because the omission occurred purely at random,
dropping that missing case does not bias the class mean. In contrast, if struggling students
deliberately left hard questions blank, that is Missing Not at Random (MNAR), which severely
corrupts statistical estimates.
log··(1000) = 3
log··(1000) = 3
log··(1000) = 3
log··(100) = 2
log··(100) = 2
log··(100) = 2
y = log(x)
x > 0
y = ·x
p < 0.001
p < 0.001
|Z| > 3.29
34
3.6 Synthetic Data Simulation with Generative AI: Golden Prompts
3-1 & 3-2
We now harness Generative AI to produce publication-grade synthetic datasets ready for
immediate deployment. Copy and paste the two Golden Prompts below into ChatGPT (GPT-4o),
Claude 3.5 Sonnet, or Google Gemini:
🌟 [Golden Prompt 3-1] Instant Restructuring of Messy Spreadsheets to
Tidy Data
COPY
&
PASTE
[Role Definition]
You are a world-class statistical software architect and data engineering specialist.
[Input Specifications]
- Research Topic: Impact of high-caffeine energy drinks on pro-gamer reaction times
-
Current
Data
Structure:
Wide-format
spreadsheet
with
columns:
Subject_ID,
Day1_Placebo_AM, Day1_Placebo_PM, Day2_Energy_AM, Day2_Energy_PM
[Task Directives]
1. Strictly enforce Hadley Wickham's 3 Tidy Data rules: each variable in its own
column, each observation in its own row, each value in its own cell.
2. Provide a column mapping table converting the wide Excel format into machine-
executable Long Format for Python Pandas, R, and SPSS.
3. Output a machine-readable JSON Tidy Data Schema.
🌟 [Golden Prompt 3-2] Realistic Synthetic Data Simulation with
Noise & Skewness
ADVANCED
SIMULATION
[Role Definition]
You are a senior data scientist specializing in cognitive neuroscience and clinical
trials.
[Experimental Constraints]
- Sample Size: N=100 participants (4 repeated measures: T0 Baseline, T1 30min, T2
60min, T3 120min)
- Target Metrics: Reaction Time (ms), Subjective Focus Score (1-100 scale)
[Task Directives]
1. Rather than naive Gaussian distributions, inject natural biological right-skewness
(Skewness > +1.0) and output a 10-row CSV sample.
2. Introduce 3% completely random missing values (MCAR, NaN) and 2 explicit outliers
(|Z| > 3.29) to reflect sensor glitches.
3. Provide Python snippets demonstrating Log10 transformation to restore normality
before running repeated-measures ANOVA.
💡 Practical Research Utility: By generating realistic synthetic data upfront, researchers can stress-
test their complete analysis pipeline (t-tests, ANOVA, linear regressions) against outliers and
missingness, ensuring zero software failures before expending actual grants.
35
3.6B SYNTHETIC PRE-TESTING
3.6B Generative AI 50-Subject Synthetic Data Generation & 4-Stage
Pre-testing Protocol
Generating mock CSV datasets in 3 seconds to dry-run analysis pipelines before recruiting participants
Novice researchers frequently spend thousands of dollars recruiting 50 participants, only to discover weeks later
that variable scales were mismatched or missing values break their statistical scripts. Before empirical data
collection, generating 50 mock subjects with Generative AI in 3 seconds and executing a comprehensive
pre-test (dry run) guarantees total pipeline integrity.
🌟 [Golden Prompt 3-3] 50-Subject Mock Experimental Dataset Generator
COPY & PASTE
[Role] You are an expert clinical and cognitive experimental data architect.
[Objective] Generate a realistic 50-subject mock CSV dataset to test an AI learning app
evaluation study.
[Data Specifications & Distributions]
1. Sample: 50 subjects (Control 25: P001~P025 / Treatment 25: P026~P050)
2. Columns: participant_id, group, pre_score, post_score, satisfaction_score
3. Statistical Parameters:
- pre_score: Normal distribution N(55, 8), integer values.
- post_score: Control shows no change N(56, 8). Treatment shows +18 pt gain N(72, 7)
treatment effect.
- satisfaction_score: 5-point Likert scale (1-5 integer), Treatment is 1.2 pts higher.
- Realistic Noise: Inject missing values (NA) at 2 random locations across the dataset.
4. Output Format: Pure CSV code block only (```csv ... ```) with zero conversational text.
🛠️4-Stage Pre-testing Protocol
Stage 1: Execute Prompt & Copy CSV
Input Golden Prompt 3-3 into ChatGPT or Claude and
copy the generated 50-row CSV code block.
Stage 2: Save as mock_study_50.csv
Paste into an editor (VS Code or Notepad) and save as
mock_study_50.csv in your project directory.
Stage 3: Dry-Run Statistical Scripts
Execute your Python (pd.read_csv()) or R script for
independent t-tests and repeated measures ANOVA.
Stage 4: Audit Missing Values & F/p Outputs
Confirm that missing values (NA) are handled gracefully
and t-statistic/p-values output without syntax errors!
💡 Why Pre-testing Protects the Entire Research Project
Completing this dry run validates your pipeline safety with 100% certainty. Once real data is collected from actual
subjects, you simply swap mock_study_50.csv with real_data.csv to output publication-ready tables and figures in 1
second.
Core Takeaway: Pre-testing with AI synthetic data eliminates downstream script failure and
guarantees data pipeline integrity!
CHAPTER 03 · AI PRE-TESTING
36
3.7 Machine-Readable JSON Tidy Schema & Python Simulation
Pipeline
In modern automated research pipelines, manual visual inspection of spreadsheets is obsolete.
To enable computational systems to verify that an incoming dataset complies with Tidy Data rules
in under 10 milliseconds, we utilize a standardized JSON Schema:
// 12_tidy_dataset_schema.json (Core Excerpt of Machine-Readable Specification)
{
"title": "TidyExperimentDataMatrixSchema", "version": "3.0.0",
"tidy_principles_compliance": {
"rule1_column_per_variable":
true,
"rule2_row_per_observation":
true,
"rule3_cell_single_value": true
},
"required_columns": [
{ "name": "subject_id", "type": "string", "scale": "nominal", "pattern": "^SUB_[0-9]
{3}$" },
{ "name": "group", "type": "string", "allowed": ["Energy_Drink", "Placebo"] },
{ "name": "timepoint", "type": "string", "allowed": ["T0_Baseline", "T1_30min",
"T2_60min", "T3_120min"] },
{ "name": "reaction_time_ms", "type": "number", "scale": "ratio", "min": 200.0, "max":
1200.0 },
{ "name": "focus_score", "type": "integer", "scale": "interval", "min": 10, "max": 100 }
],
"data_integrity": { "expected_rows": 400, "unique_subjects": 100, "max_missing_rate": 0.05
}
}
Python Pandas-Based Automated Integrity and Skewness Verification
The script
14_simulate_and_tidy_data.py included in the Reader Lab Kit executes full
integrity checks and skewness diagnostics using only NumPy and Pandas, requiring zero external
dependencies:
# 14_simulate_and_tidy_data.py Core Verification Pipeline
df = pd.read_csv('13_sample_dataset_energy_drink_tidy_sim.csv')
# 1. Detect Real-World Missing Values (MCAR)
missing_cnt = df['reaction_time_ms'].isna().sum()
print(f"Missing count: {missing_cnt} cases ({missing_cnt/len(df)*100:.1f}%)")
# 2. Compute Native Skewness and Log Transformation
clean_rt = df['reaction_time_ms'].dropna()
skew_raw = clean_rt.skew() # Positive Skew (+1.1245)
skew_log = np.log10(clean_rt).skew() # Normality Restored (-0.0812)
print(f"Raw Skewness: {skew_raw:+.4f} -> Post-Log Skewness: {skew_log:+.4f}")
Loading all 400 observations (100 subjects × 4 timepoints) in milliseconds, this script numerically
demonstrates the transformation of heavy right skewness (+1.12) into near-zero Gaussian symmetry
(-0.08) through simple base-10 logarithmic scaling.
37
3.8 AI Hands-on Workshop: Reader Lab Kit and Execution Guide
With theoretical principles firmly established, it is time to run the simulation on your local
machine. The Google Drive Reader Lab Kit repository provides 5 fully audited companion files for
Chapter 3. Scan the QR code or follow the repository link, and execute the four-step workflow
below.
Download Lab Kit QR
Chapter 3 Lab Kit
Google Drive Reader Repository (Free Access)
•
11_AI_Golden_Prompts_Ch3.md : Copy-and-paste Golden Prompts for
instant execution
•
12_tidy_dataset_schema.json : Machine-readable JSON specification
for Tidy Data validation
•
13_sample_dataset_energy_drink_tidy_sim.csv : 400-row synthetic
dataset (100 subjects × 4 timepoints)
• 14_simulate_and_tidy_data.py : Python verification script testing 3 Tidy
rules and skewness
•
15_study_guide_and_ch3_solutions.md :
Review
solutions
and
advanced missingness imputation guide
🛠️
[4-Step Practical Protocol] "Follow This Exact Execution Sequence"
Step 1 [Download Assets]: Scan the QR code or navigate to Google Drive to download the 5 Chapter 3
files into your local directory (e.g., stats_ch3/ ).
Step 2 [Generate AI Synthetic Data]: Prompt ChatGPT or Claude with [Golden Prompt 3-2] from
11_AI_Golden_Prompts_Ch3.md to generate synthetic noisy data and inspect the AI diagnosis
report.
Step 3 [Execute Python Verification Code]: Open your terminal, navigate to the folder, and execute
the automated verification script:
python3 14_simulate_and_tidy_data.py
Step 4 [Compare Outputs & Diagnose]: Compare the console terminal output with [Figure 3-3] on the
next page and verify all criteria on the 4-Point Self-Diagnosis Checklist.
38
3.9 Output Verification, 4-Point Self-Diagnosis Checklist & Part 2
Preview
When you execute the Python script in your terminal, the resulting console diagnostics and the
Generative AI synthetic dataset report must match [Figure 3-3] with 100% precision:
[Figure 3-3] Chapter 3 Verification Dashboard: (Top) Python Terminal Integrity & Skewness Diagnostics / (Bottom) AI
Synthetic Matrix Report
✅ 4-Point Self-Diagnosis Checklist for Execution Integrity
✓ [Check 1] 400-Row Rectangular Tidy Data Rules Passed: Did your dataset of 100 subjects × 4 repeated
timepoints pass all 3 Tidy rules (variable=column, observation=row, value=cell) with zero merged cells?
✓ [Check 2] Realistic Missingness (MCAR) Rate Detected: Did the terminal console confirm exactly 14 missing
values (3.5%) distributed randomly across reaction times?
✓ [Check 3] Right Skewness Measured and Corrected via Log10: Did the raw positive skewness (Skewness ≈
+1.42) converge to near-perfect symmetry (Skewness ≈ +0.18) post-log transformation?
✓ [Check 4] Energy Drink vs. Placebo Performance Trend: At the 60-minute peak (T2), did the Energy Drink
group exhibit approximately 20ms faster reaction times than the Placebo group?
PART 2 PREVIEW
Part II: Principles of Research Statistics & AI-Driven Data Extraction
Chapter 4: Mathematical Mechanisms of Statistical Models: Signal-to-Noise Ratios and Variance Partitioning
🚀
39
PART 02 · STATISTICAL MECHANISMS & AI DECODING
Part
II:
Principles
of
Research
Statistics
and
AI-Powered
Data
Extraction & Decoding
Beyond Blind p-Value Faith: Unraveling the Geometric Partitioning of
Variance and Parametric Models
■ Part II Overview: Why Mathematical Mechanisms Matter in the AI
Era
Modern statistical software and Generative AI can generate complex F-ratios,
t-values, and p-values in a fraction of a second with a single prompt. However,
simply because machines automate computation does not mean researchers
can remain mathematically blind. On the contrary, in an age where algorithms
handle calculation, the critical intellectual value of a scientist lies in deep
comprehension: "Why did this number emerge?", "How were signal and
noise partitioned?", and "Is this p-value a genuine scientific finding or an
artifact of statistical hallucination?"
The era of rote mathematical memorization is over. Part II demystifies the
universal General Linear Model (GLM), the geometric partitioning of variance in
ANOVA, the perils of multiple comparisons, and robust parametric/non-
parametric
execution
using
intuitive
physical
analogies
and
visual
infographics accessible to high schoolers and college freshmen alike.
■ PART 2 CHAPTER ROADMAP
CHAPTER 04
Mathematical
Mechanisms
of
Statistical Models
Signal-to-Noise Ratio
(SNR), ANOVA variance
partitioning
geometry,
Family-wise
Error
inflation,
and
effect
sizes.
CHAPTER 05
AI-Powered
Parametric Statistics
& Inference
Independent/paired t-
tests,
one-way/two-way
ANOVA,
regression
analysis pipelines, and
APA
7th
reporting
automation.
CHAPTER 06
Assumption
Violations
&
Non-
Parametric Protocols
Normality
and
homoscedasticity
diagnostics,
Mann-
Whitney U, Wilcoxon, and
Kruskal-Wallis
emergency protocols.
40
🇰🇷 한국어 정규 에디션 (교보문고 바로출판 POD 120p 완제 원문) 🇰🇷 한국어 에디션 (KO) 🇺🇸 Global Edition (EN) CHAPTER 05 AI를 활용한 핵심 모수 통계 추출과 결과 해석 다중 선형 회귀부터 Two-Way ANOVA, 정밀 데이터 테이블 설계 및 학술 차트 시각화까지 [그림 5-0] AI 다변량 통계 분석 연구실: 복잡한 수학 공식 대신 3차원 회귀 평면과 감성 텍스트를 시각화하여, AI와 함께 변수 간의 숨은 인과 관계를 직관적으로 해독하는 최첨단 연구 환경. 🎯 제5장 핵심 학습 목표 (고등학생도 3초 만에 꿰뚫는 데이터 과학의 핵심) 1. 다중 회귀의 입체적 기하학: 점들을 잇는 단순한 직선 하나를 넘어, 여러 원인이 얽힌 3차원 공간에서 최적의 '회귀 평면'을 찾는 원리를 이해합니다. 2. 회귀계수의 본질: 비표준화 계수 B의 실생활 단위 의미와 표준화 계수 β를 통해 어떤 원인이 가장 강력한지 서열을 매깁니다. 3. 5단계 통계 판별 로드맵: 연구 질문과 변수 유형에 따라 t-검정, ANOVA, 다중회귀를 단 3초 만에 판별하는 결정 트리를 마스터합니다. 4. 합리적 데이터 구조 & 구글 드라이브 실습: Long vs Wide 포맷 설계 및 구글 드라이브 실습 키트(CSV/파이썬)의 1클릭 실행법을 체득합니다. 5. 300 DPI 출판용 그래프 시각화 & AI 프롬프트: 바이올린 플롯, 신뢰대역 회귀도, 잔차 진단도를 파이썬과 AI로 추출합니다. PART 02 · STATISTICAL MECHANISMS & AI DECODING 62 5.1 MULTIVARIATE MODELING 5.1 단순 선형에서 다중 회귀로: 한 걸음 더 들어가는 다변량 모델링 원인이 단 하나뿐인 세상은 없다: 1차원 직선에서 3차원 '회귀 평면'으로의 도약 여러분이 오늘 본 시험 점수는 단순히 어제 책상에 앉아 공부한 ...
🇰🇷 한국어 정규 에디션 (교보문고 바로출판 POD 120p 완제 원문) 🇰🇷 한국어 에디션 (KO) 🇺🇸 Global Edition (EN) CHAPTER 01 가설 수립과 변수 명세 일상의 막연한 호기심을 AI가 이해하는 날카로운 데이터 잣대와 조작적 정의로 바꾸기 [그림 1-0] AI와 함께하는 신나는 연구 탐험: 일상의 사소한 호기심도 AI와 함께 올바른 잣대를 세우면 위대한 과학적 발견이 됩니다. 🎯 제1장 핵심 학습 목표 (고등학생부터 연구원까지 누구나 꿰뚫는 원리) 1. AI의 거짓말(환각) 차단하기: 왜 AI에게 "이 앱 공부에 도움 돼?"라고 물으면 엉터리 답을 내놓는지, 그 원인과 '조작적 정의'의 위력을 배웁니다. 2. 검은 백조와 탐정의 원칙: 과학적 가설은 "내 생각이 맞다"고 우기는 게 아니라, 법정의 '무죄 추정'처럼 "틀렸음을 증명할 예외(반증)"를 찾는 게임임을 이해합니다. 3. 개구리 경주와 4대 척도: 1등과 2등의 점수 차이는 1점일 수도, 50점일 수도 있다! 왜 등수의 평균을 구하면 AI가 망가지는지 4가지 숫자 계급을 마스터합니다. 4. 아이스크림의 거짓말(교락 변수): 아이스크림 판매량과 물놀이 익사 사고가 함께 늘어난다고 해서 아이스크림이 범인일까? 숨어있는 진짜 범인(날씨)을 밝혀냅니다. 5. AI 골든 프롬프트 1-1 실전 활용: 내가 가진 사소한 아이디어를 입력하여, 결측치 없는 머신 판독형 JSON 연구 계획서와 가상 데이터셋을 즉시 뽑아냅니다. PART 01 · FOUNDATION ARCHITECTURE · PAGE 7 7 SECTION 1.1 1.1 왜 AI에게 "이 앱 공부에 도움 돼?"라고 물으면 안 될까? 주관적 형용사의 함정과 기계를 작동시키는 '조작적 정의(Operational Definition)' 친구들과 주말...
🇰🇷 한국어 정규 에디션 (교보문고 바로출판 POD 120p 완제 원문) 🇰🇷 한국어 에디션 (KO) 🇺🇸 Global Edition (EN) APPENDIX A 부록 A. 통계 검정 선택 원페이지 결정 로드맵 연구 질문, 종속변수 척도, 집단 수, 정규성 만족 여부에 따른 3초 통계 모델 결정 트리 연구 현장에서 어떤 분석 기법을 선택해야 할지 혼란스러울 때, 아래의 3단계 의사결정 순서도를 따라가면 단 3초 만에 최적의 모수/비모수 통계 모델을 선택할 수 있습니다. 연구 질문 및 목적 독립변수 (X) 종속변수 (Y) 정규성 만족 (모수 통계) 정규성 위반 (비모수 대안) 두 집단 평균 비교 (서로 다른 사람) 범주형 (2집단) (예: AI군 vs 통제군) 연속형 (등간/비율) (예: 점수, 완료율) 독립표본 t-검정 (Independent t-test) 맨-휘트니 U 검정 (Mann-Whitney U) 동일 집단 전후 비교 (동일인의 사전-사후) 범주형 (2시점 반복) (예: 교육 전 vs 교육 후) 연속형 (등간/비율) (예: 반응시간 차이) 대응표본 t-검정 (Paired t-test) 윌콕슨 부호순위 검정 (Wilcoxon Signed) 세 집단 이상 비교 (1개 요인) 범주형 (3집단 이상) (예: A vs B vs C) 연속형 (등간/비율) (예: 학업 성취도) 일원 분산분석 (One-Way ANOVA) 크루스칼-월리스 검정 (Kruskal-Wallis H) 두 요인의 교차 효과 (2×2 요인 설계) 범주형 2개 요인 (예: 처치 × 숙련도) 연속형 (등간/비율) (예: 시험 점수) 이원배치 분산분석 (Two-Way ANOVA) 비모수 순위 분석 또는 붓스트래핑 (5,000회) 연속형 변인 간 예측 (인과 및 영향력 검증) 연속형 1개 이상 (예: 사용시간, 감성점수) 연속형 (등간/비율) (예: 최종 성과 지표) 다중 선형 회귀분석 (Multiple Regression) 강건 ...